TrustChain360

SUPPLIER RISK INTELLIGENCE PLATFORM

Identify supplier risks
before they become business risks.

TrustChain360 connects operational signals, supplier performance, dependencies and business impact into one risk picture — so companies can see where action matters most.

The B2B SaaS platform for critical supplier relationships — from assessing new suppliers to managing existing ones.

Currently in validation

TrustChain360 / SupplierExample data · Q3

PRECISION PARTS / SUPPLIER B

Where we act first.

Priority 01
Performance
60/100
↓ 14 points vs. Q2
Annual Risk Exposure€420,000Modelled exposure
Sourcing structure
Single Source
Supply criticality
High · critical
Annual procurement spend
€2 million
Next step
Align delivery planning
A better score than Supplier A. Greater dependency. A stronger reason to act together first.
Schematic product view. Exposure is an illustrative assumption, not a loss or loss forecast.

01 / PERFORMANCE AND RISK

Good performance does not automatically mean low risk.

A precision component. A reliable supplier. Until you look more closely.

A milling machine working on a metal component.
SUPPLIER B · PRECISION COMPONENTS · ILLUSTRATIVE EXAMPLE
Delivery reliability
96 %
Complaint rate
0.4 %
Pricing
Stable

A CLOSER LOOK

The full picture changes the decision.

The metrics show performance. They do not yet show how much your business depends on this supplier.

01 · One component. No short-term alternative.

A single source supplies a production-critical component with a long lead time. Even a small deviation can affect several teams.

02 · Stable metrics can hide growing effort.

In this illustrative scenario, investment is delayed, capacity tightens and coordination takes more time. These are signals to investigate, not proof of a loss.

03 · Context reveals the priority.

TrustChain360 connects performance, dependency and business impact to answer a practical question: where should we act first?

Explore the shared risk picture →

Would you rate this supplier “green” today?

Illustrative example, not customer data. Describes signals to investigate, not automated financial or capacity monitoring.

02 / THE PLATFORM

One supplier.
Different perspectives.

Everyone sees a part. TrustChain360 brings the picture together.

Three people discussing a component in a technical workshop.
Procurement
Commercial terms, performance and sourcing dependency.
Quality
Quality deviations and recurring issues.
Supply Chain / Logistics
Delivery reliability and availability.
Production
Operational disruption and additional effort.
Development
Technical dependency and change.
Finance
Assess business impact.

Functional perspectives, not additional scoring dimensions. No automated integrations are implied.

One platform. A shared risk picture.Connect the perspectives →

03 / BUSINESS IMPACT

Lower purchase price.
Higher real cost.

Purchase price is visible. The full cost of the supplier relationship often isn't.

The same component. The same annual volume. A different view of cost. Adjust the assumptions to compare.

Tool and metal surface during machining.
Supplier costs
Purchase price, quality consequences, logistics, internal effort and production impact.
Risk Exposure
Modeled financial exposure in the context of performance and dependency.

A cost example, not a risk score. Measured costs, estimated consequences and modelled Risk Exposure must remain distinct.

Understand the business context
What does your supplier really cost?Illustrative scenario
Same component · same demand

Purchase price: B costs €1.20 less per unit.

SUPPLIER A / Europe

+€0.57 additional cost / unit

Effective cost per unit in this example€11.77
Annual cost in this example€141,240
View cost breakdown
Purchase price
€11.20
Coordination
+€0.18
Delivery / logistics
+€0.11
Quality-related costs
+€0.16
Other operational effort
+€0.12

SUPPLIER B / China

+€2.54 additional cost / unit

Effective cost per unit in this example€12.54
Annual cost in this example€150,480
View cost breakdown
Purchase price
€10.00
Coordination
+€1.27
Delivery / logistics
+€0.42
Quality-related costs
+€0.37
Other operational effort
+€0.48
Annual cost difference A − B−€9,240€9,240 cost advantage for Supplier A in this example€0.77 lower cost / unit × 12,000 units / year

Largest difference in additional cost: Coordination · B +€1.09 / unit compared with A.

When does the decision change?

B has a purchase price advantage of €1.20 / unit. It disappears when B generates €1.20 more additional cost than A. Currently: €1.97 more / unit.

Both suppliers use the same illustrative effort scale. Low, Medium and High combine coordination, logistics, quality and operational effort. All amounts are per unit; there are no volume discounts or fixed costs.

Price: €0–10,000 · Quantity: 1–1,000,000

Illustrative scenario, not a product calculation or savings guarantee. Location alone does not determine quality. Performance, dependency and the actual effort involved in the supplier relationship matter.

04 / PLATFORM LOGIC

From supplier signals
to business action.

Operational data, qualitative experience, context and business impact inform priorities and actions.

  1. 01

    SIGNALS

    Identify signals

    Bring observations from different teams together.
  2. 02

    ASSESS

    Assess the risk

    Review dependency, criticality and trends.
  3. 03

    IMPACT

    Understand business impact

    Distinguish consequences, assumptions and evidence.
  4. 04

    PRIORITIZE

    Prioritize

    Explain which actions matter most in the business context.
  5. 05

    ACT

    Manage actions

    Agree ownership, a due date and the target outcome.
  6. 06

    REASSESS

    Reassess

    Review implementation and what has actually changed.

A shared decision process: from operational and qualitative signals to reviewing what has actually changed.

05 / FROM EXPERIENCE

Grounded in experience.

Florian Herding
TrustChain360

“I have seen a supplier look inexpensive on paper, while creating more work, more quality issues and higher costs for the business.”

An attractive unit price. A strong business case. Then quality issues, delivery problems and growing coordination effort. What the calculation missed became visible in day-to-day operations.

That experience raises the question behind TrustChain360: what does a supplier relationship really cost us, and when does it become a business risk?

Discuss your supplier situation with Florian →

SEE SUPPLIERS IN CONTEXT

One portfolio.
Many dependencies.

Individual signals become meaningful when seen together.

A critical component. No alternative. Several affected teams. The same delivery deviation can have very different consequences.

TrustChain360 puts the assessment in this context.

From signal to priority →
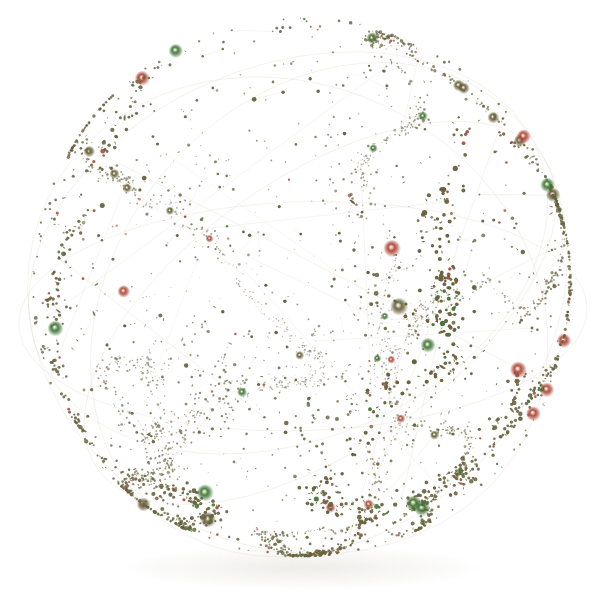
Conceptual supplier network of particles and connections
Suppliers · signals · dependencies
Conceptual visualization · Colors, sizes and impulses do not indicate real supplier status

06 / CONTEXT

See the score.
Understand the dependency.

PerformanceCriticalityBusiness Impact

Performance describes observed results. Criticality describes how much your business depends on a supplier.

The platform connects these perspectives with financial exposure, giving priorities a clear business rationale.

Distinguish performance, criticality and Business Impact

07 / ACTION & REASSESSMENT

Identifying a risk factor
is not yet an improvement.

What matters is what happens next — and what the evidence supports.

ILLUSTRATIVE CASE / UNRELIABLE DELIVERY DATES

Risk & priority
Supply of a critical component is at risk. Agree on the need for action.
Ownership & action
Procurement and planning agree a reliable delivery schedule with the supplier.
Due date & target outcome
Implement before the next assessment period, aiming for fewer unplanned delivery deviations.
Reassessment
Review delivery data, effort and implementation again. Has the risk actually decreased?

Risk Reduction needs evidence. A better score alone proves neither the effect of an action nor realized savings.

Explore actions and reassessment
TrustChain360 / ActionsExample data

Stabilize delivery planning

In progress

SUPPLIER B · PRIORITY 01

Owner
Strategic procurement
With the supplier
Agree the delivery schedule
Due date
30 September
Expected impact
To be quantified
Deviation
Delivery instability
Consequence
Premium freight
Review
Q4 follow-up assessment
Understand the business relevance of actions

Consider original risk, planned and realized risk reduction within the impact model, and residual risk together. A change in the model does not prove actual savings.

Schematic product view · Agree ownership, review implementation, monitor progress.
Review progress after the action
SUPPLIER PERFORMANCE TIMELINE

Go beyond assessment.
Understand progress.

Example data

Supplier B · four assessment periods

82746066 Q1Q2Q3Q4
Q3 → Action agreedStabilize the delivery schedule. Review progress and implementation together in Q4.
Timeline values and interpretation
Example supplier score history
PeriodScore / 100Change from previous period
Q182–
Q274−8
Q360−14
Q466+6

The increase alone does not prove the action's impact. Assessment scope, implementation and other influencing factors must also be reviewed.

08 / SUPPLIER REALITY CHECK

Supplier Reality Check

One real supplier. Different perspectives. A shared risk picture.

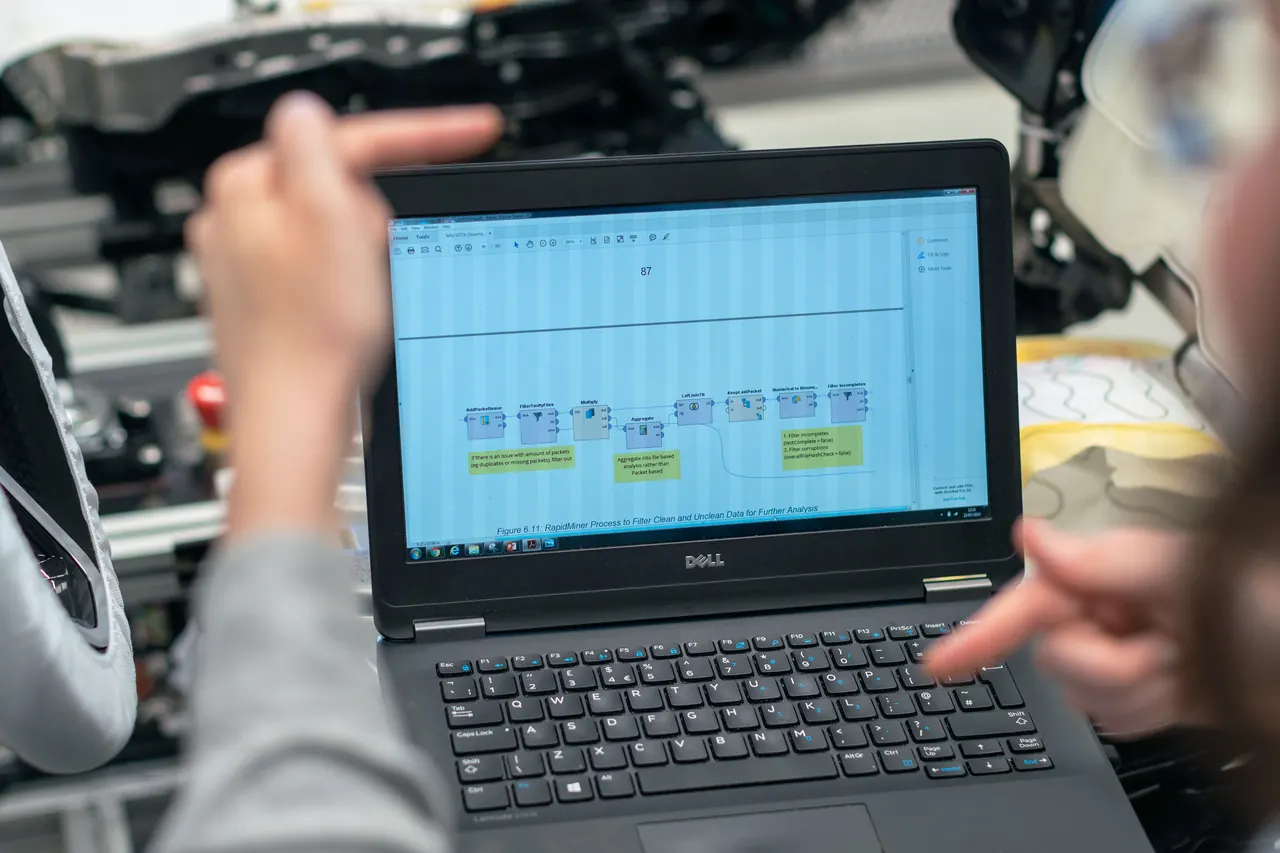
People reviewing measurement data on a laptop at a technical workstation.
  1. Choose a supplier
  2. Gather perspectives
  3. Connect risks with business impact
  4. Prioritize areas for action

WORKING OUTPUT / POSSIBLE STRUCTURE

One page.
The questions that matter.

Supplier context
Component · Dependency · Supply relevance
Shared risk picture
Signals · Contradictions · Open questions
Business impact
Costs · Additional effort · Assumptions
Next steps
Priority · Ownership · Reassessment

Preview of a possible output structure, not a customer report. Depth and outcome depend on the case and available information.

Discuss a Supplier Reality Check

Start with 30–45 minutes: Florian Herding, your existing information and a specific supplier situation.

PLATFORM IN VALIDATION

We are currently validating the platform with procurement, supply chain, quality and operations professionals. The product vision is clear. Its implementation is being shaped with the market.

DECISIONS YOU CAN EXPLAIN

A sound basis for decisions.

Performance, criticality and business impact answer different questions. Our methodology makes those distinctions explicit.

Explore the methodology

WEBSITE PRIVACY

Transparency about data.

Our privacy notice explains website hosting, email contact and local processing in the website simulator.

Read the privacy notice

MISSION

Distributed knowledge.
Meaningful insight.

TrustChain360 turns distributed operational signals and experience across supplier relationships into transparent, comparable and economically meaningful insight.

VISION

Understand critical relationships.
Act earlier.

A world where critical supplier relationships are transparent, understood and actively managed before operational issues become business risks.

Existing package model — for context

TrustChain360 is in validation. The existing package model is a planning baseline, not a price quote for the Supplier Reality Check.

The packages describe the intended scope of functionality. Implementation and activation are confirmed in your individual offer.

Discuss pricing and terms with us. Supplier and user scope, onboarding and contract duration are agreed in your individual proposal.

View the planned packages and scope

START WITH YOUR CASE

When does a supplier problem become a material business risk for your company?

Let's look at a real supplier case together.